EDSpice Simulator
The EDSpice Simulator, which is similar to Mixed Mode Simulator, provides the facility to analyze and validate the functionality and behavior of circuits.
The interactive module of EDSpice provides seamless integration between the simulator and the rest of the system. The core of the package is the EDSpice Simulation Engine, which performs the simulations and outputs the results.
This module includes a set of function tools to prepare circuits for simulation,
initiate the execution of analyses, and review the results graphically for textually.
Steps for EDSpice Simulation
Evoke EDSpice Simulator
Circuit simulation starts with invoking the interactive module of EDSpice Simulator from Schematic Editor/ Preference. The user interface is similar to other EDWinXP applications. The schematic diagram of a circuit may be either created or an existing project can be opened from the project explorer window. The same rules govern the selection and interaction with database objects (schematic components and nets) and these objects are referred to as circuit elements and nodes, respectively, according to SPICE conventions.
Preprocess the circuit
The circuit is preprocessed before simulating and is invoked from Simulation menu. Preprocessing confirms whether the circuit is ready for simulation. It should be performed at all times, when elements have been added or deleted from the circuit or connectivity between them is changed.
In the case of a newly captured circuit, the setup of instance and model parameters
of the elements must be defined before any simulation is executed.
Set initial conditions for Simulation
Certain global parameters, preset options and conditions for analyses are passed to the simulation engine in the netlist. Dialog windows for defining the contents, lines such as OPTIONS (Simulator variables), .IC (Initial Condition) and .NODESET (Initial Node Voltage Guesses) may be accessed from the Setup dropdown menu.
Run Analysis
The simulation process is initiated by selecting one of the available analyses, setting up the required parameters, and starting its execution. When the selected analysis is executed, the interactive module extracts a SPICE netlist, stores it in a file called EDSPICE.CIR, and a group of commands are passed to the simulation engine. The set of commands that the interactive module passes to the simulation engine depends on the type of analysis, required contents of the results and the form in which the results are to be displayed.
The SPICE netlist of the circuit can be viewed from Options | View EDSpice Files ... | Circuit (SPICE Netlist).
After the commands are received, the simulation engine parses the netlist generated by the interactive module, executes the selected analysis and stores the results in the output files RAWSPICE.RAW and EDSPICE.OUT.
Result of analysis
When the interactive module gets confirmation that the simulator engine has completed the analysis, the results of simulation are processed for presentation. When the whole process is completed the results are displayed in graphical or textual form.
SPICE Simulation
The circuit is represented in the form of a text file called 'circuit file' (.CIR file). This file can be created using any text editor and submitted to SPICE (Simulation Program with Integrated Circuit Emphasis) for analysis.
Steps for using SPICE
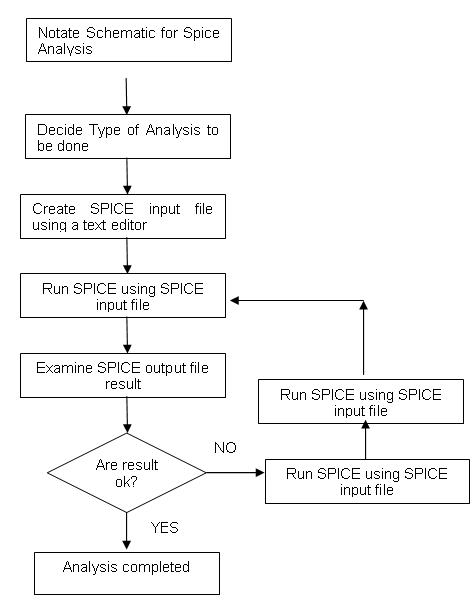
1. Start with the schematic diagram and notate it for SPICE consisting of three
steps:
• Name component or circuit element
• Assign a node (a point of connection between two or more circuit elements) as node zero. This is the ground node, and all other circuit node voltages will be expressed with respect to this node.
• Each additional node in the circuit is given a node number, which must be a positive integer. The order in which the nodes are numbered is arbitrary, and node numbers need not be sequential. Each node must be connected to at least two elements.
2. Decide the type of analysis. SPICE can do DC, AC, Transient, DC transfer function, DC small-signal sensitivity, distortion, noise and Fourier analyses. Based on the types of analyses, one or more control lines have to be added to the input file. A control line could specify the values of DC voltage or current for a source, range of frequencies an ac source is to have, or the time interval over which a transient analysis is to take place and the time step size to be used
3. Create an input file for SPICE using a text editor. Use only capital letters, the first line must be a title line and it should end with ‘.END’.
4. Execute the analysis.
Circuit File Editor
The circuit file (.CIR file) describes the circuitry to be analyzed in a format that the SPICE simulation engine can interpret.
Invoke Circuit File Editor, from Simulation | Circuit File Editor of EDSpice Simulator.
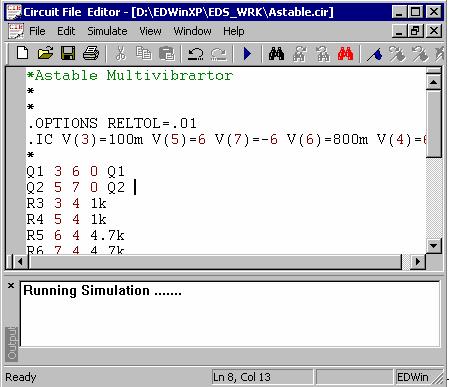
Fig. 7.2
To perform simulation, follow the steps mentioned below:
1. Click on File | New.
2. A new window pops up within Circuit File Editor. Paste the circuit file information in this window. Save the information with a suitable name by clicking File | Save.
3. To simulate, click on menu Simulate.
4. The output of simulation is displayed in Waveform Viewer
The circuit file of Astable Multivibrator and its output are shown below (Fig 7.3)
Circuit File
*Astable Multivibrartor
.OPTIONS RELTOL=.01
.IC V(3)=100m V(5)=6 V(7)=-6 V(6)=800m V(4)=6Q1 3 6 0 Q1
Q2 5 7 0 Q2
R3 3 4 1k
R4 5 4 1k
R5 6 4 4.7k
R6 7 4 4.7k
C7 3 7 4.7U
C8 5 6 4.7U
V9 4 0 DC 6.MODEL Q1 NPN CJE=1p TF=10n CJC=1p
.MODEL Q2 NPN CJE=1p TF=10n CJC=1p
*CODE MODEL DEFINITIONS
.TRAN 10U 100M
.SAVE V(7) V(5)
.SAVE V (3) V (6)
.END
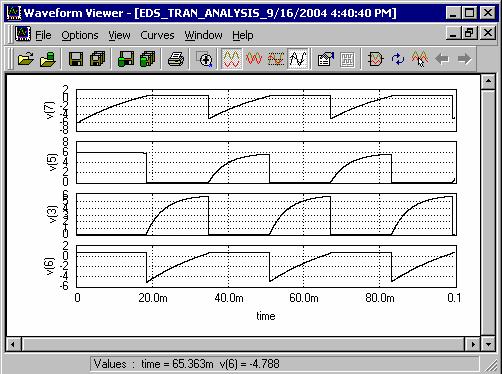
Fig 7.3
EDSpice Interactive Interpreter
This dialog is displayed when Simulation | Analysis |EDSpice Interactive Interpreter is selected. In this case, this window is as shown in figure 7.4 and displays details of the simulation.
This may also be invoked directly from a SPICE netlist of *.CIR format without creating the Schematic.
Writing a .CIR file –
EDSpice | Simulation | EDSpice Interactive interpreter | New/Edit Circuit | File | New.

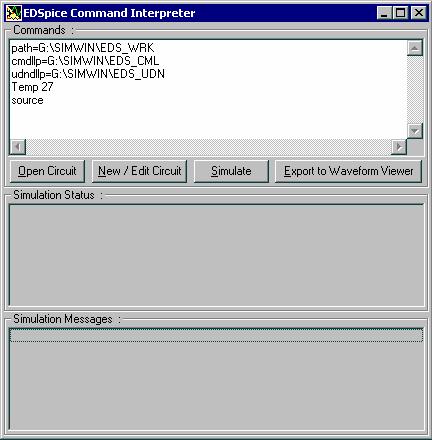
Fig 7.4
Any input file for SPICE should contain
1. a title line
2. element lines for each element in the schematic.
3. a .END line
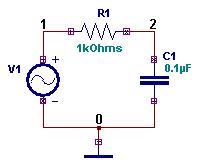
The following example shows the circuit file for an RC Integrator and to plot its Transient simulated output:
* Title line * Element line for each element * Voltage Source description * Transient Analysis * Save results for Waveform Viewer * .End line |
 |
Simulating a .CIR file
EDSpice | Simulation | EDSpice Interactive interpreter | Open Circuit | Select the .cir file | Simulate.
If .SAVE option is not given in the cir file, then the simulator outputs the simulation results to ‘rawspice.raw’. Click on Export to Waveform Viewer and then select the rawspice.raw file to display the outputs in Waveform Viewer. (Refer Fig.7.5)
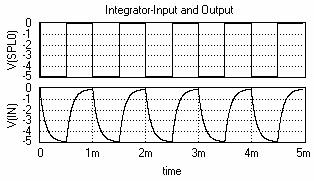
Fig 7.5
SPICE Control lines to obtain the output:
.PRINT: To display the result of each analysis in
the textual format as a set of values.
Example: 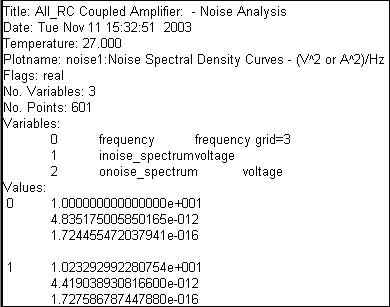 |
. PLOT: To plot the points obtained after each analysis. Example: 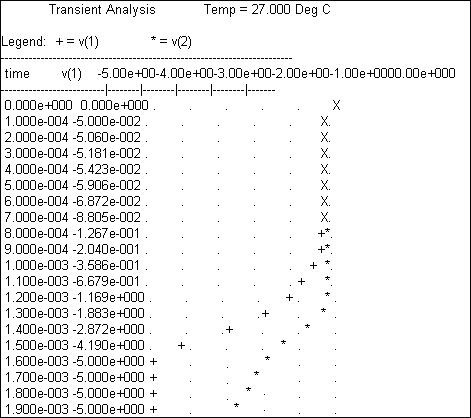 |
Types of Analysis supported by EDSpice Simulator
EDSpice provides different types of analyses as shown in Fig 7.6.
- Transient Analysis
- Small Signal AC Analysis
- DC Transfer Function Analysis
- Distortion Analysis
- Operating Point Analysis
- Noise Analysis
- DC/AC Sensitivity Analysis
- Transfer Function Analysis
- Pole-Zero Analysis
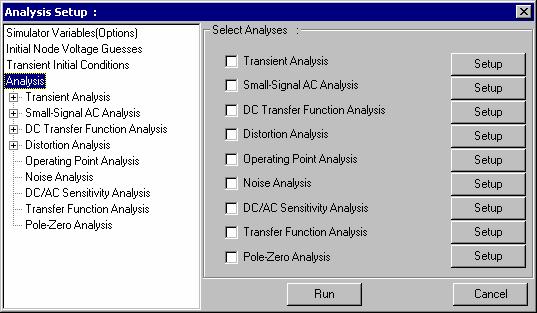
Fig 7-6
Transient Analysis
Refer sample project (EDWinXP/ Job/ MIXMODE_EDSPICE/ Amplif.EPB)
Procedure
Define parameters to the circuit elements-
Right click on the work space, select Change Simulation Parameter from Component Properties, then click on each component, and enter values except for those components having simulation references assigned to them.
Click on the AC source to pop up the Instance Parameter window (Refer Fig. 7-7) in which values are to be defined. Scroll down to get the instance parameter Source function. Click on the row corresponding to Source Function (last row of this dialog box) to get another window of Source function where you may select the source function and define the function parameters for the selected one. Select “Sine” from the list and specify the following parameter values.
Frequency 500Hz
Amplitude 1V
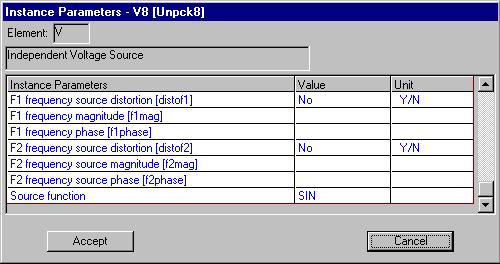
Fig. 7-7
Click ACCEPT to get the Instance Parameter window.
Similarly enter the simulation parameters for all the circuit elements.
Test the transient state of the circuit-
The transient analysis is done after setting the parameters for analysis. Select Analysis/ Transient Analysis from the tree view on the left side of the window and then give the necessary set up parameters in the Set Parameters on the right side of the window
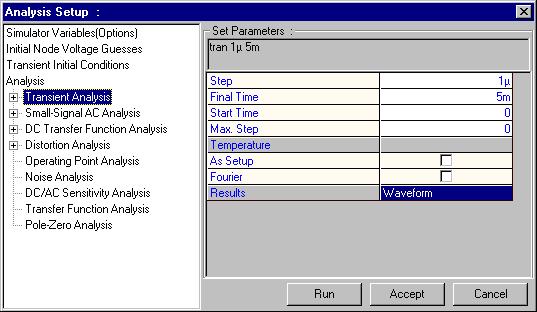
Fig. 7-8
Enter the required values for the parameters Step, Final Time, Start Time in the Analysis window. Indicate how the results are to be displayed (No Output/ waveform/ Standard Output) immediately at the end of the simulation. e.g.: Enter Step value as 1 µs, Final Time as 5ms and Start Time as 1µs.
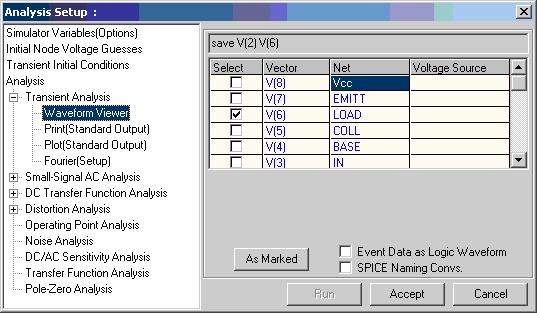
Fig.7.9
Click on Waveform Viewer option in the tree diagram under Transient Analysis to select the values to be displayed in waveform or click on As Marked button. (Fig 7.9)
Click ACCEPT button to accept the changes and to automatically switch to ANALYSIS. Transient analysis is opted for analog circuits with inductors and capacitors.
Click RUN button to start simulation
SPICE control line:
TRAN TSTEP TSTOP TSTEP – Step time |
E.g. .TRAN 1µ 5m TSTOP – Final (stop) time |
The simulation engine parses the netlist generated and when simulator engine has completed the analysis, the results of simulation are displayed in either graphical or textual form. The results are stored in the output files RAWSPICE.RAW and EDSPICE.OUT. The waveform viewer pops up with the result as shown below in Fig. 7.10.
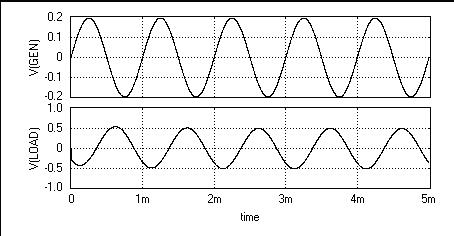
Fig. 7.10
Small Signal AC Analysis
Refer sample project (EDWinXP/ Job/ MIXMODE_EDSPICE/ Amplif.EPB)
Procedure
In order to run Small Signal AC Analysis, specify the analysis parameters by selecting Analysis/ Small Signal AC Analysis from the tree view. Specify the simulation parameters such as start frequency, end frequency, total points, Variation etc (Refer Fig. 7-11).
E.g.: For a given amplifier circuit, assign 10 as total points, Start Frequency as 10Hz and End Frequency as 1GHz and set the Variation as Decade.
If ‘As Setup’ is checked, the analysis is performed at a defined temperature. You can set temperature from the Setup menu / Temperatures. If this option is not checked, the operating temperature is taken as 27° C. Select the format by which results are to be obtained from Results dropdown and select from No Output/Waveform/Standard Output. Click on Waveform option in the tree diagram under Small Signal AC Analysis and either check the values whose waveforms are to be displayed or click on As Marked. Also specify the nature of the output waveforms- real/imaginary/magnitude/20 log10.
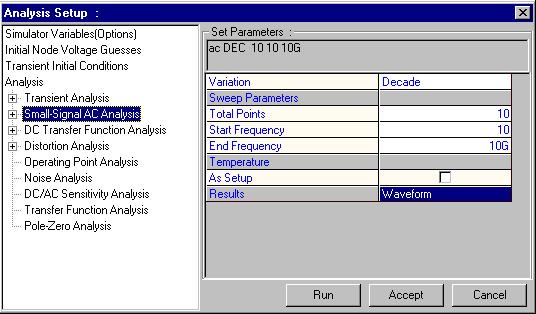
Fig. 7.11
Click ACCEPT button to accept these values and on RUN button to execute the analysis. In case you specified PRINT or PLOT results you may view it by selecting "Options -> View EDSpice Files -> Standard Output".
SPICE control line:
.AC LIN NP FSTART FSTOP .AC DEC ND FSTART FSTOP .AC OCT NO FSTSRT FSTOP |
LIN NP- Linear no. of points DEC ND-Decimal no. of frequencies/decade OCT NO-Octal no. of frequencies per octave |
FSTART-Start frequency FSTOP-Stop frequency E.g.: .AC DEC 100 10 100K |
DC Transfer Function Analysis
Refer sample project (EDWinXP/ Job/ MIXMODE_EDSPICE/ Amplif.EPB)
Procedure
In order to run DC Transfer Function Analysis, specify the analysis parameters by selecting Analysis/ DC Transfer Function Analysis from the tree view.
Since this analysis gives the behavior of the circuit with respect to varied voltage /current, two sources are required to run the analysis. Thus the variation of one value corresponding to changes in the other can be plotted. For this, specify the start and stop voltages for first and second source for which the analysis is to be done.
‘Step’ defines the number of points to be included for specifying the range of voltage on the X-Axis.
If ‘As Setup’ is checked, the analysis is performed at the temperature set from the menu Setup/ Temperatures. If this option is not checked, the operating temperature is taken as 27° C. Select the type of presenting results from ‘Results’ dropdown and set the parameters as per the selection made for Waveform Viewer, Print (Standard Output), Plot (Standard Output) and Fourier (Setup). Click ACCEPT button to accept these values and on RUN button to execute the analysis. In case you specified PRINT or PLOT results you may view it by selecting "Options -> View EDSpice Files -> Standard Output".
Distortion Analysis
Refer sample project (EDWinXP/ Job/ MIXMODE_EDSPICE/ Amplif.EPB)
Procedure
In order to run Distortion analysis, specify the analysis parameters by selecting Analysis/ Distortion analysis from the tree view. Specify the simulation parameters such as start frequency, end frequency, total points etc as shown in figure.
If you have two signals at the input, and you need a study of Intermodulation distortion, specify the value of F2OVERF1 and select the check box. If ‘As Setup’ is checked, the analysis is performed at the temperature set from the menu Setup/ Temperatures. If this option is not checked, the operating temperature is taken as 27° C. Select the result type from ‘Results’ dropdown and set the parameters as per the selection made for Waveform Viewer, Print (Standard Output), Plot (Standard Output) and Fourier (Setup). Click ACCEPT button to accept these values and on RUN button to execute the analysis. In case you specified PRINT or PLOT results you may view it by selecting "Options -> View EDSpice Files -> Standard Output".
SPICE control line:
|
.DISTO RLOAD INTER <…<…>> E.g.: .DISTO ROUT 5 0.5 |
RLOAD-Output Resistor INTER-Interval |
This must be used along with .AC control line
Operating Point Analysis
Refer sample project (EDWinXP/ Job/ MIXMODE_EDSPICE/ Amplif.EPB)
The program should be informed about the results. The default
selection is "As Marked". This means that results are displayed at
all Voltage, Current and Logic State markers placed on the circuit. After analysis,
the results will be presented by updating the markers. The values at all nodes
and branches of the circuit, select "All Points". The results will
be available in the default .raw file RAWSPICE.RAW located at \.\EDS_WRK. You
may view it by selecting "Options -> View EDSpice Files -> Rawfile"
SPICE control line:
.OP
Noise Analysis
Refer sample project (EDWinXP/ Job/ MIXMODE_EDSPICE/ Amplif.EPB)
SPICE is capable of modeling the following kinds of electronic noise:
• Thermal noise
• Shot noise and
• Flicker noise
Noise analysis is used to analyze the noise existing at any point in a circuit, due to the combined effect of all noise sources in the circuit.
Procedure
In order to run Noise analysis, specify the analysis parameters by selecting Analysis/ Noise analysis from the tree view. Specify the simulation parameters such as start frequency, end frequency, total points etc.
If ‘As Setup’ is checked, the analysis is performed at the temperature set from the menu Setup/ Temperatures. If this option is not checked, the operating temperature is taken as 27° C.
After analysis, the results will be presented as follows:
• the Noise Spectral Density curves will be presented in the Waveform Viewer.
• the total integrated Noise, (along with other data), will be presented in the .raw file RAWSPICE.RAW. You may view it by selecting "Options -> View EDSpice Files -> Rawfile”.
SPICE control line:
| • .NOISE OUTPUTV INPUTSRC NUMSUM • E.g.: .NOISE V(2) VIN 10 |
• OUTPUTV-Output Voltage • INPUTSRC-Input Source/Independent Voltage or Current source • NUMSUM-Summary Interval |
DC/AC Sensitivity Analysis
Refer sample project (EDWinXP/ Job/ MIXMODE_EDSPICE/ Amplif.EPB)
In order to run DC or Small-Signal AC Sensitivity Analysis, specify the analysis parameters by selecting Analysis/ DC or Small-Signal AC Sensitivity Analysis from the tree view. Specify the simulation parameters. If you require only a DC Sensitivity Analysis, make sure the "AC Sensitivity" check box is not selected. (However, make sure it is checked if you want an AC Sensitivity Analysis.). If ‘As Setup’ is checked, the analysis is performed at the temperature set from the menu Setup/ Temperatures. If this option is not checked, the operating temperature is taken as 27° C. Select the type of presenting results from ‘Results’ dropdown and set the parameters as per the selection made for Waveform Viewer. Click ACCEPT button to accept these values and on RUN button to execute the analysis.
After analysis, the results will be presented as follows:
• the results of a DC Sensitivity Analysis will be presented in the .raw file RAWSPICE.RAW.
• the results of AC Sensitivity Analysis will be presented in the Waveform Viewer. The full results can be examined by selecting "Options -> View EDSpice Files -> Rawfile".
SPICE control line:
| .SENS OV1 <OV2> E.g:.SENS V(3) I(VIN) |
OV1-Output Variable(Voltage or Current) |
Transfer Function Analysis
Refer sample project (EDWinXP/ Job/ MIXMODE_EDSPICE/ Amplif.EPB)
The magnitudes of the following quantities can be obtained by means of a Transfer Function Analysis:
• Voltage Gain
• Current Gain
• Transfer Impedance
• Transfer Admittance
In order to run Transfer Function Analysis, specify the analysis parameters by selecting Analysis/ Transfer Function Analysis from the tree view. Specify the simulation parameters (usually frequency and phase angle). Click ACCEPT button to accept these values and on RUN button to execute the analysis. After analysis, the results will be presented in the .raw file RAWSPICE.RAW.
SPICE control line:
.TF OUTPUTVAR INPUTSRC E.g.: .TF V(10) VIN |
OUTPUTVAR-Output Variable(Voltage or Current) INPUTSRC-Input Source(Small Signal Input Source, Voltage/Current) |
Pole-Zero Analysis
Refer sample project (EDWinXP/ Job/ MIXMODE_EDSPICE/ Amplif.EPB)
In order to run Pole-Zero Analysis, specify the analysis parameters by selecting Analysis/ Pole-Zero Analysis from the tree view. Specify the simulation parameters. Click ACCEPT button to accept these values and on RUN button to execute the analysis. After analysis, the results will be presented in the .raw file RAWSPICE.RAW.
SPICE control line:
.PZ NODE1 NODE2 NODE3 NODE4 CUR POL .PZ NODE1 NODE2 NODE3 NODE4 CUR ZER .PZ NODE1 NODE2 NODE3 NODE4 CUR PZ .PZ NODE1 NODE2 NODE3 NODE4 VOL POL .PZ NODE1 NODE2 NODE3 NODE4 VOL ZER .PZ NODE1 NODE2 NODE3 NODE4 VOL PZ |
E.g.: .PZ 1 0 3 0 CUR POL .PZ 2 3 5 0 VOL ZER .PZ 4 1 4 1 CUR PZ PZ –Pole and Zero CUR-Current VOL-Voltage |
Control line for Temperature:
.TEMP T1 <T2 <T3….>> T1,T2 etc. are in centigrade.
E.g.: .TEMP –30 150
SPICE Netlist Import
Saving Circuit as a Subcircuit
If required the design may be saved as a subcircuit in the subcircuit library and later may be adapted to a symbol. The input and output nodes of the subcircuit must be assigned to appropriate entries of the symbol.
Assign subcircuit nodes
The dialog window Setup/ Subcircuit I/O Nodes allows to select subcircuit input and output nodes and arrange them in a proper sequence in the node list. Moreover, a short description may be attached to each node to explain its function. This description may be helpful for proper recognition of the nodes when a subcircuit is associated with a symbol.
Save as subcircuit
After assigning the subcircuit nodes this may be saved to the library by selecting
“Options|Save as subcircuit”.
