Introduction to Simulation
The Purpose
Simulation provides a detailed analysis of the circuit behavior. For the virtual simulation of a circuit, the real model of the circuit is created by taking all factors into consideration, and the appropriate inputs are given. Then the outputs at each level are checked and corrections or modifications are made.
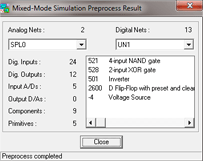
EDWinXP provides two types of Simulators. The Mixed Mode Simulator may be used for simulating analog and digital circuits. The EDSpice Simulator is provided for the users who prefer to work with SPICE.
Mixed Mode Simulator
SPICE is an acronym for Simulation Program with Integrated Circuit Emphasis, developed by University of California, Berkeley. SPICE is an important tool for learning circuit analysis and design, and for testing electronics circuits.
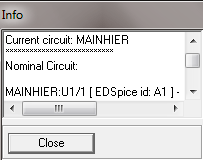
EDSpice Simulator provides the facility to analyze and validate behavior of circuits captured in the form of Schematic diagrams using SPICE.
EDSpice Simulator
It is possible to view the analysis in the virtual Cathode Ray Oscillograph available with the simulator. This multi channel Oscillograph gives a running waveform and it is possible to change the element parameters and view the changes while running the simulation.
Waveform Viewer is used to display and postprocess the results of analyses in graphical form and if required, the results may also be presented textually.
Types of analysis supported by EDWinXP
The different types of analyses that can be done in EDWinXP are listed below. The simulator that supports the analysis is given in brackets i.e. Name of analysis (Simulator name-MMS or EDS). MMS-Mixed Mode Simulator, EDS is EDSpice Simulator.
Bias Point Calculation (MMS)/ Operating point Analysis (EDS)
A Bias Point Analysis / Operating Point Analysis is the simplest analysis that can be done using the Simulator. It is used to determine the DC behavior of a circuit; in other words, the DC bias conditions.
When the analysis is performed, all capacitors are open-circuited and inductors are short-circuited for calculating the values. This is because a bias point analysis is performed using DC values, at which inductors are effectively short circuits, and capacitors are open circuits. The values generated remains until next preprocess is given. This is the reason why; it is necessary to preprocess once the circuit topology is changed.
Even though the bias point calculation is not done this is analysis is automatically
done during AC and Transient analysis.
Transient Analysis (MMS and EDS)
The transient analysis computes the transient output variables (voltage and current) as a function of time over a user-specified time interval. The initial conditions are automatically determined by a dc analysis. All sources which are not time dependent (for example, power supplies) are set to their dc value. The transient time interval is specified on a control line.
Transfer Function Analysis (MMS)
The transfer function analysis calculates the small signal ratio of the output node to the input source. This is done along with Transient analysis.
Transfer Function Analysis (EDS)
The transfer function analysis calculates the small signal ratio of the output node to the input source, and also the input and output impedance of a circuit. This analysis may be used to determine the small signal gain and the input and output impedance of filter circuits. Any nonlinear models, such as diodes or transistors, are first linearized based on the DC bias point, and then the small signal DC analysis is performed.
Parameter Analysis (MMS)
This analysis calculates the change in the output of a given circuit when a selected parameter of a particular circuit element is varied over a range of values. The corresponding output is plotted just as in the case of Transient analysis. The variation in the parameter value can be done in two ways:
1. Sweep, where the start and end values of the parameter can be entered and analysis is carried out in the specified step value.
2. Step, where the different parameter values for which analysis is to be performed can be specified.
Fourier Analysis (MMS/EDS)
This performs a Fourier analysis of an output variable when done with Transient analysis. Computes the amplitudes and phases of the first nine frequency components (harmonics) of a user-specified fundamental frequency, as well as the DC component.
DC Sweep Analysis (MMS)
This is a non-linear analysis, which determines the DC operating point of the circuit. Capacitors are open-circuited and inductors are short-circuited during DC analysis. One or more sources (current and voltage) may be stepped over a range. Results of the analysis at each source value may then be viewed in the waveform generator.
It is used for obtaining the small signal DC bias solution of a circuit, as one independent source sweeps over a range of values. It is also often used for obtaining the characteristic output curves of semiconductor devices.
AC Sweep (MMS)/Small Signal AC Analysis
AC Sweep analysis is a linear small-signal analysis, over a user defined frequency range, and based on the linearized small signal AC model values of all circuit elements at the operating point. It is used to obtain the small signal AC behavior of the circuit. This can be used to study the frequency response, gains, Trans impedances, Bode Plots, etc. of a circuit. It can also be used to know the phase changes in a circuit. The various output modes are magnitude; phase, real, imaginary and 20log of gain.
Monte Carlo (MMS)
The Monte Carlo analysis is used for simulations with a given error on different components. This test is very useful for visualizing how the circuit will run if imperfect components as are used in reality. The Monte Carlo analysis allows the user to input two things:
• The percent error of a given circuit element can be defined. This is the purpose of the Monte Carlo Analysis, i.e. to apply an error to components. If the finished product will have resistors with a 5% error, the simulation can include this deviation.
• The type of error can be defined as either Gaussian (normal), or Uniform. The Gaussian mode of simulation is more realistic than the uniform mode. The Gaussian mode uses a bell curve approach as it randomly pick values in the range of error specified but with the majority of the values near the resistor value.The Uniform mode of deviation randomly selects values within the range specified oblivious of what the actual value of the resistor is. This mode of deviation is more suited for a situation where the value of the resistor is not known precisely.
Sensitivity Analysis (MMS)/ DC/AC Sensitivity Analysis (EDS)
This will calculate sensitivity of an output variable (voltage and current) with respect to all circuit variables, including model parameters. This calculates the difference in an output by changing each parameter of each circuit element independently. This also displays the highest sensitive element in the circuit.
DC Transfer Function Analysis
A DC Transfer Function Analysis is used to obtain the variation in circuit voltages and/or currents, with respect to variations in either one or two, independent source/s, at DC Bias conditions. It is used for obtaining the small signal DC bias solution of a circuit, as one (or two) independent source sweep over a range of values. It is also often used for obtaining the characteristic output curves of semiconductor devices.
Noise Analysis (EDS)
The noise analysis does analysis of device-generated noise for the given circuit. When provided with an input source and an output port, the analysis calculates the noise contributions of each element (and each noise generator within the element) to the output port voltage. It also calculates the input noise to the circuit, equivalent to the output noise referred to the specified input source.
Distortion Analysis (EDS)
The distortion analysis computes steady-state harmonic and intermodulation products for small input signal magnitudes. If signals of a single frequency are specified as the input to the circuit, the complex values of the second and third harmonics are determined at every point in the circuit. If there are signals of two frequencies input to the circuit, the analysis finds out the complex values of the circuit variables at the sum and difference of the input frequencies, and at the difference of the smaller frequency from the second harmonic of the larger frequency.
Pole-zero Analysis (EDS)
A Pole-Zero analysis is used to compute poles and zeroes of
a small signal AC transfer function of the form
of the circuit. Pole-zero analysis is most commonly used for determining the
stability of control circuits.
This computes the poles and/or zeros in the small-signal ac transfer function. The program first computes the dc operating point and then determines the linearized, small-signal models for all the nonlinear elements in the circuit. This circuit is then used to find the poles and zeros.
Two types of transfer functions are allowed: (output voltage)/ (input voltage) and (output voltage)/ (input current). These two types of transfer functions cover all the cases and one can find the poles/zeros of functions like input/output impedance and voltage gain. The input and output ports are specified as two pairs of nodes.
General requirements to simulate the circuit
Simulation
Before simulation all the circuit elements used in the project should be identified by the simulator. In SPICE, the circuit elements are identified by the name assigned to each element which in turn will invoke the necessary function (simulation function) associated with the element (This is already made available to the user in SPICE.)
E.g.: In SPICE, a resistor is identified with the program by the Letter R.
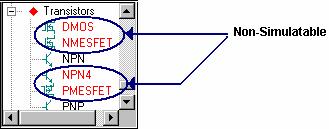
Therefore, generally for simulation, a circuit should consist of circuit elements which contain the required simulation information attached and supported by the Simulator. (In Mixed Mode simulator, the simulation information is stored in a 'Primitive' while in EDSpice it is stored in a 'Model'. Both exist in the EDWinXP library in the form of.dll format). Mixed-Mode Simulator marks all components which do not have their primitives as the "non-simulatable components" (marked in red) and ignores them during simulation.
Model
This dictates the behavior of a circuit element during simulation. This is available from the model library and the simulation function links the element to its specified model.
Simulation function
It is an integer number identifying a primitive that models this component. A Simulation Function is a sort of identifying tag which tells the simulator that information required to simulate the behavior of a component (Simulation primitive) is available in Library. When a Schematic is created, the Simulation Functions assigned to each of the parts are also loaded.
Simulation Primitives:
The Simulation Primitive contains information required by the simulator to simulate a component. We can simulate only those parts that have a simulation primitive available for it. They are present in the Library Directory in the form of Dynamic Link Library files (*.DLL). The symbol of each component stores the Simulation Function and so does the primitive. At the time of simulation, Mixed Mode simulator searches for a primitive in the library containing this Simulation function and retrieves the required information to simulate the component.
Before simulation, invoke the Preprocess command to make any changes (adding/removing
circuit elements) effective.
There are two kinds of primitives: Logic and analog. Logic primitives (gates, flip-flops, counters, etc.) have positive simulation functions. Analog primitives (resistors, inductors, transistors, etc.,) have negative ones. Simulation function equaling to zero is used for non-simulated components.
In addition, all used entries of the symbol must have proper simulation names that match pin names defined in the corresponding DLL simulation primitive module.
Tips: To speed up the simulation it is recommended
to simulate separate parts of the project using a number of equivalent electrical
schematics.
Preparing the Circuit for Simulation
Several steps are involved when preparing a circuit for simulation. Preprocess the circuit for any change in the schematic to be reflected during simulation.
Placing Test points
EDWinXP allows to place test points and waveform markers in
the circuit with the tools available in Instruments
in either of the editors. (Mixed Mode and EDSpice).
The list of options enables the user to set ground, place test points, add/change value of each element, place markers to display the resultant waveforms after the completion of each analyses, to reassign simulation parameters and so on.
In Mixed Mode Simulator, Select Instruments | Test points
to view values of voltage, current, Logic States at specific points, select
the option
Set Waveform Contents to place markers at points where the waveforms
are to be displayed. Different options are available to place waveform markers
at specific points namely Current, Voltage and Logic Waveform.
For EDSpice Simulator, Select Instruments |
Probe Results option to obtain the current/voltage values at specific points
in the circuit and
Set Waveform Contents to place Waveform Markers for current, voltage
or logic waveform at places where the results are to be displayed graphically.(Refer
the figure given below)
The function tool bar under Instruments and their functionality for Mixed Mode and EDSpice Simulators are given in Fig. 5.2.
| Mixed Mode Simulator | EDSpice Simulator |
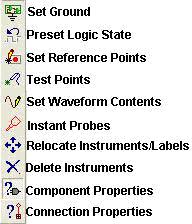 Fig 5.2 Figure 5-3 shows different test point and markers assigned in a circuit in Mixed Mode Simulator. 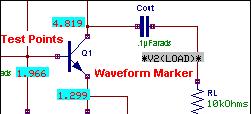 Fig 5-3 |
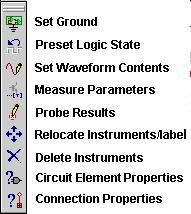
Figure 5-4 shows different test point and markers assigned in a circuit in EDSpice Simulator 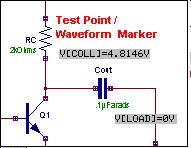 Fig 5-4 |
Assigning Simulation Parameters
Before initiating simulation on the circuit, the simulation
parameters for various circuit elements have to be specified. This is done by
selecting the Component Properties
Function tool and the option tool Change Simulation Parameters
from the list.
With this option enabled click on any circuit element whose parameters have to be changed or assigned and a window pops up (Fig. 5.5) where necessary entries can be made or edited.
In Mixed Mode Simulator module, a window as shown in Fig.5.5 pops up. Here, the parameters can be edited, loaded from the library or saved in the system library.
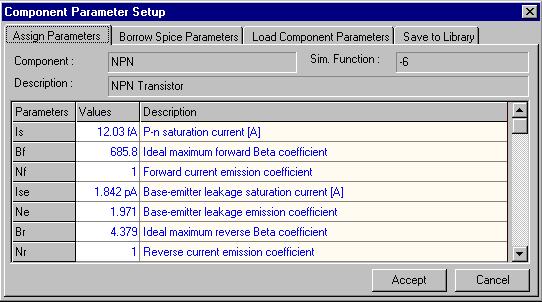
Fig. 5-5
EDSpice Simulator provides options to load models from
the system library and also to change the parameters of circuit elements. Enable
Assign Simulation Parameters
option from the Component Properties
function tool and click on the element and a window pops up where the required
changes can be made (Fig. 5-6).
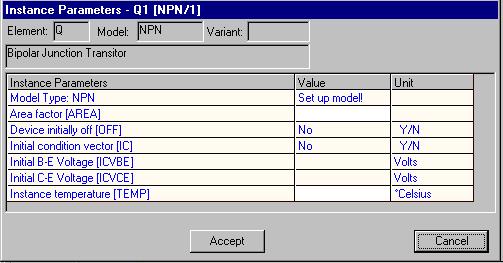
Fig.5.6
When clicked on Set up model you get a window as shown in Fig. 5.7, where when clicked on ACCEPT the default model is taken or to load spice models from the system Library, click on Load From Library option and load the required model from the displayed list.
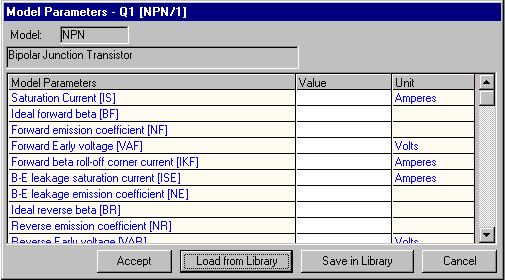
Fig. 5.7
Setting the Input Pulse/Clock
Next, set the input stimuli to the circuit. This can be done
by selecting the Function tool
Preset Logic State and then the Option tool
Clock Generator. Click on the wire where the input has to be applied.
E.g.: In the case of a Half Adder circuit, it has
to be the input wires A and B. Click on A, an input box appears with a
drop down list from where the required string for the clock pulse can
be selected or a new string can be typed in. Enter the string (L20u, H20u),
a label G! gets tagged to the cursor, place it next to the wire A. Similarly
click on B and enter the string (L10u, H10u) or select a string from the
existing list. (Refer Fig.5-8). |
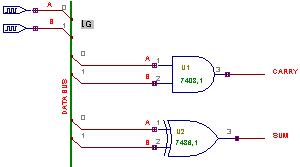 Fig 5.8 |
Apart from selecting a pulse from the given list one may also set a pulse or clock according to the requirement using the different options provided in the clock editor (Refer Fig. 5-9). Two different set of options are available for setting up a pattern either a single pattern or a repeated one. A pattern can be set by selecting from the dropdown list L/H/Z (i.e. Low, High, High Impedance). Similarly the duration can be chosen for the pulse in ms/us/ns. Click Add to obtain the pattern and click Set Pattern to apply it. Clicking ACCEPT will affirm the operation.
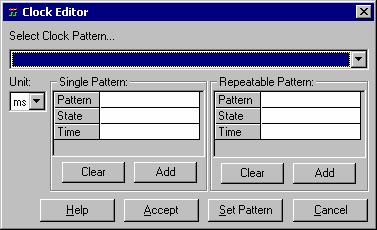
Fig 5.9
E.g.: To set a pulse of Low state for 10 ms and High state for 20µs, select the appropriate options and click set. The string appears as: L10ms, H20us.
To set a clock, check on the item clock of Low State for 20µs and High for 20µs and click Set. The string appears as :{ L20u, H20u}.
This string (L20u, H20u) is a clock generator. Since this string is enclosed within brackets, this will repeat the pattern given in the string till the Final Time specified in Simulation menu | Analysis.
The truth table of the Half Adder is as follows:
| A | B | SUM | CARRY |
| 0 | 0 | 0 | 0 |
| 0 | 1 | 1 | 0 |
| 1 | 0 | 1 | 0 |
| 1 | 1 | 0 | 1 |
In order to test for all the given conditions at one time, the input stimulus can be given according to the conditions specified in the truth table. Let us assign an arbitrary period of say 10µs for each Condition specified in the Truth Table, therefore, within 40µs (4 conditions x 10µs) the results required for analysis of this circuit is obtained.
A – the column for A is 0 0 1 1, i.e. A should be low for 2 periods and then high for 2 periods. This can be set as (L20u, H20u).
B – the column for B is 0 1 0 1, i.e. B should be low for 1 period and then high for 1 period this can be set as (L10u, H10u).
After the analysis is carried out, the results are either displayed
in the Waveform Viewer. Right click and select the function tool
Set Waveform Contents and then the option tool
Logic Waveforms. Now click on net A and place the waveform marker near
the wire. Similarly click on the other nets, B, CARRY and SUM and place their
respective waveform markers.
Obtaining the results
The results after each analysis can be obtained in the desired format.
In Mixed mode, the results can be viewed in a multi channel Oscillograph in real time or can be viewed in a waveform viewer. Outputs in text format can be viewed in an ASCII file viewer.
In EDSpice Simulator, the results may be viewed either in the waveform viewer or the Logic Analyzer, which allows to get the result in textual format.
Waveform Viewer is used to generate results graphically for Mixed Mode Simulator and EDSpice Simulator. The Waveform represents the data generated by simulators to present the simulation results in a graphical format. This can be displayed on the screen, print or saved as a part to be placed on the actual schematic drawing.
The functionality of Waveform Viewer (Fig. 5.10) has been enhanced to examine the resultant waveforms of different analyses in a better way. In the Waveform Viewer, there is no limit to the number of variables that can be loaded. At the same time it is capable of handling any number of samples and hence the simulation time has no limit. The Waveforms may be saved to or loaded from a project. Several Waveforms can be tiled together to view on a single screen. Tools have been made available to allow users to change the presentation style of the Waveform with ease.
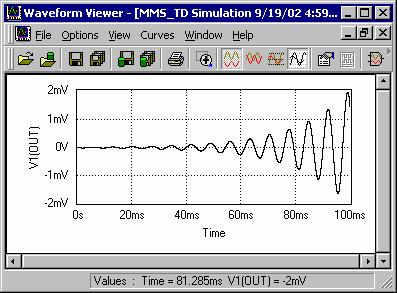
Fig 5.10